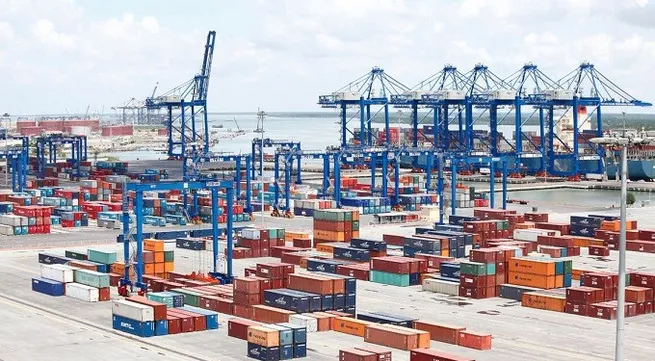
Vietnam poses a trade surplus of US$5.9 billion in nine months

According to the General Statistics Office (GSO), the domestic economic sector exported US$59.57 billion worth of goods during the period, representing a year-on-year increase of 16.4% and accounting for 30.7% of the total.
Meanwhile, the export revenue of the foreign-invested sector (including crude oil) hit US$134.73 billion, up 5% year on year and making up 69.3% of the total value.
As many as 26 products recorded over US$1 billion in export turnover during the January-September period. Phones and parts topped the list with US$38.6 billion, up 5.1% year on year, followed by electronics, computers and components (US$25.4 billion, up 16.9%), garments and textiles (US$24.8 billion, up 10.4%), footwear (US$13.3 billion, up 13.5%), machinery and equipment (US$12.9 billion, up 7.5%) and wood and timber products (US$7.5 billion, up 17%).
Vietnam’s nine-month import revenue was estimated to reach US$188.42 billion, up 8.9% from a year ago, with the domestic sector and the foreign invested sector posting respective revenues of US$78.97 billion (up 14%) and US$109.45 billion (up 5.5%).
The United States was the largest importer of Vietnamese products during the period with a value of US$44.9 billion (up 28.2% year on year), followed by the European Union (31.1 billion, down 0.7%), China (US$27.8 billion, down 3.8%), ASEAN (US$19.4 billion, up 4.7%), Japan (US$15.1 billion, up 10%) and the Republic of Korea (US$14.5 billion, up 8.1%).
Meanwhile, China remained Vietnam’s largest import market with a revenue of US$55.5 billion, up 17.3% over the same period in 2018. The Republic of Korea came second at US$35.4 billion (up 1%), then come ASEAN at US$24.1 billion (up 3.8%), Japan at US$14.1 billion (up 1.8%), the EU at US$11 billion (up 10.3%) and the US at US$10.7 billion (up 12.6%).
Tags:


